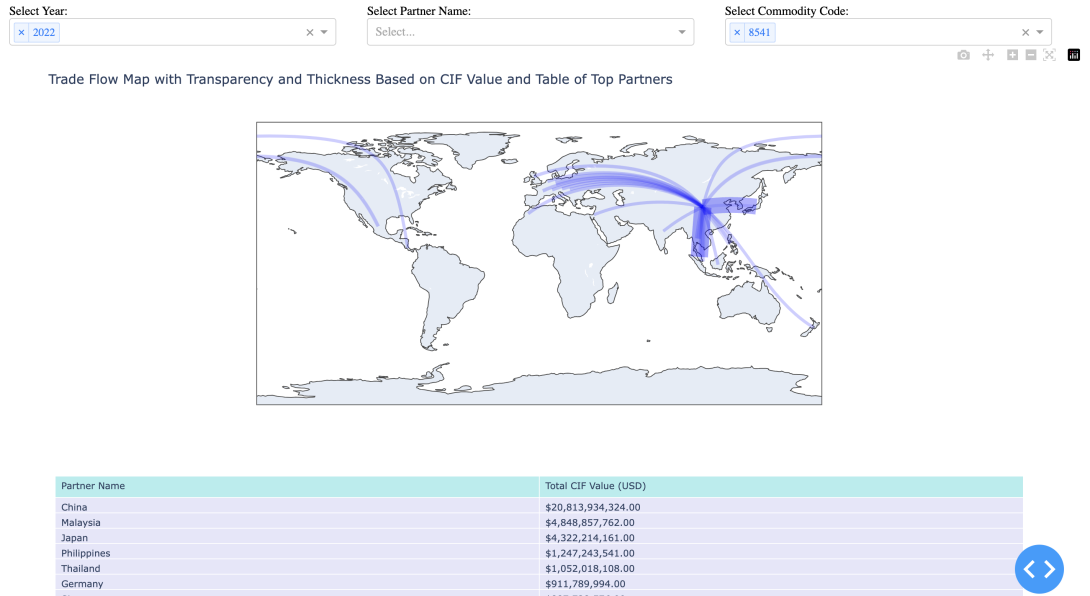
Analysis of trade data can provide insight both into general trends in trade and specific transactions of concern. Trade data can be sourced at both the transactional and aggregate level. Analysis of aggregate trade data often requires custom tools such as flow maps. Under this project, tools to collect, visualise and analyse UN Comtrade data are being developed. An example of this is the trade map, a flask-based flow map for UN Comtrade data.
The tool leverages an HS correlation table based on the WCO STCE enforcement guide to identify HS code categories of higher interest.
This project includes tools to automatically retrieve data from Comtrade and to generate graphs such as the one shown in this post. The tool is currently written in Python but could be refactored to use React and to run dynamically in a browser. Subject to Comtrade licensing, the tool could also store the data in a database rather than rely on ad-hoc querying.